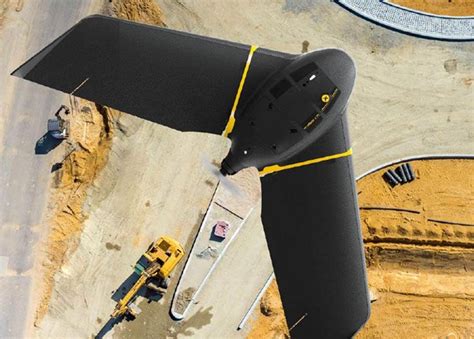
The framework created is responsible for automating the tasks of monitoring and surveillance of safety conditions within an Oil & Gas construction site. Drones are the tool used for collecting photos by capturing the current state of work at a certain moment over time.
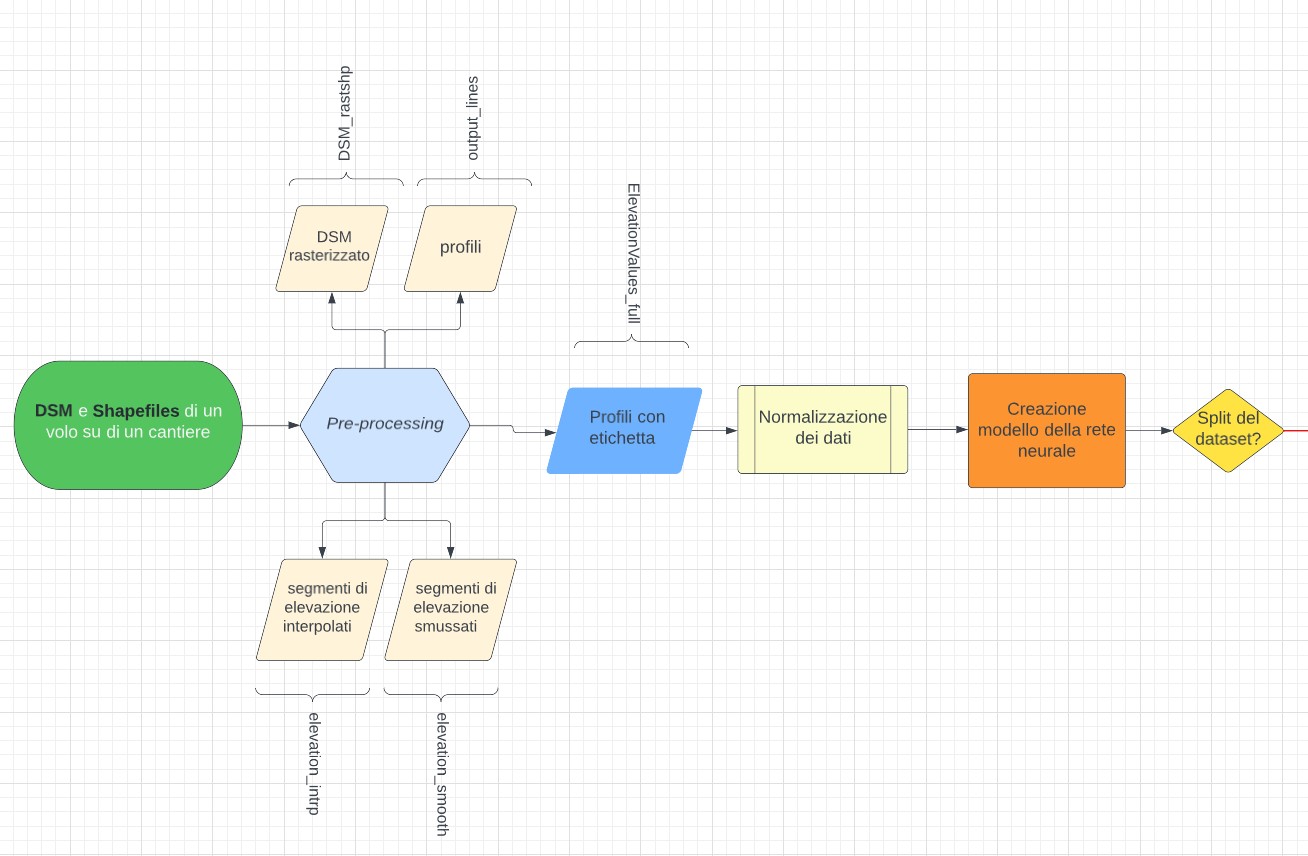
Through the use of QGIS software and specific python classes, these images are then processed in the pre-processing phase. It aims to create DSM profiles, that is a digital model of the surface relative to the flight considered. The dataset for training models of one-dimensional convolutional neural networks (1D CNN) consists of some of the flights already carried out by drones, and which present greater heterogeneity between classes.
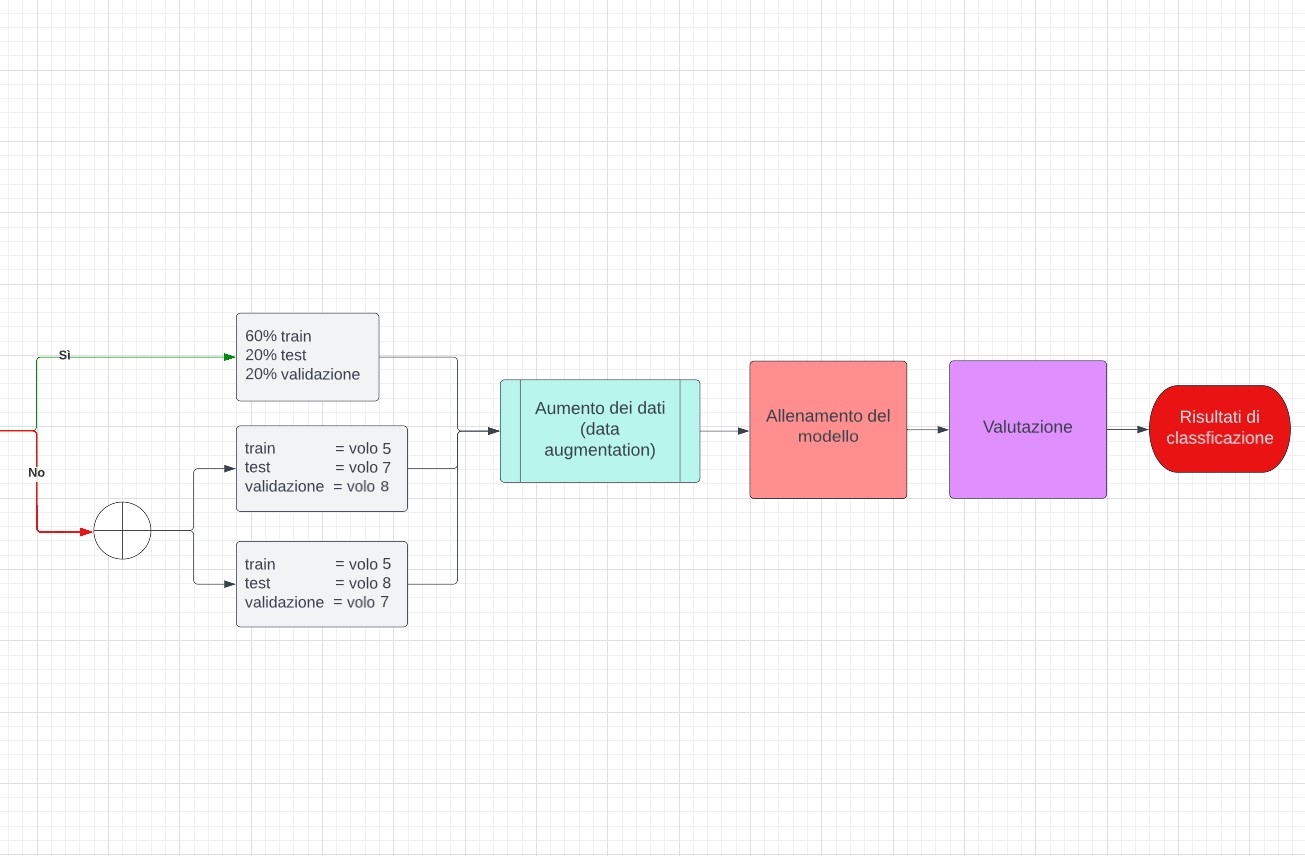
The ultimate goal is to create models that identify three different classes along the entire extension of the track works: open-trench pipeline, closed-trench pipeline and pipe laying. Therefore, thanks to data augmentation techniques, customization of a class, optimization of hyperparameters and splitting of the dataset, it has been extended a pre-existing binary classification to create a multi-class one. In the various experiments we wanted to generalize the cases analyzed on the same flight, on a different flight of the same construction site, and finally on the flight of another construction site.
The results have shown excellent prediction accuracy levels for testing on a subset of the model training, and with some marginal differences, for testing on different flights in the area of the construction site considered. Meanwhile, the results concerning the last case study differ from the previous two because the models are generated through datasets related to a construction site, and then tested on datasets from another construction site; Here it has been experienced that a substantial increase (double or more) of the real data provided to the model for training, for example, from merging the datasets of two flights, brings an increase in overall predictions accuracy with less imbalance between the minority classes.
Results links:
Confusion matrix calculated on the dataset of flight 3, Zone A, with the model 5-8


