
The application in the repository is a REST API that can provide weather information previously saved in a dataset that contains: historical, current, and future forecast data (all related to a predetermined period).
Dataset
The dataset, which contains data for the cities of Trieste, Ortona and Venice, is constructed with two different :
- dati-attuali (current data) & dati-storici (historical data) are already parsed as JSONArray objects via the route “/save” of SpringBoot app
- previsioni-future (futures forecast) are collected from the respective OpenWeather API as is, via a call to the Postman client (and subsequently parsed via the SpringBoot app)
Forecast from 01/01/2021 to 10/01/2021
- current data : 01/01 - 05/01
- historical data : 06/01 - 10/01
- future forecast: 06/01 - 10/01
Format of returned data
Metadata related to the dataset data :
{
"date": "2021-01-06 12:00:00",
"visibility": 7000.0,
"cityname": "Venice",
"timeUNIX": 1609934400,
"wind": {
		"speed": 2.9
	}
 }
Metadata related to historical data statistics data:
{
"visibilityStats": {
	"visibilityMax": 10000.0,
	"visibilityMin": 300.0,
	"visibilityAverage": 7660.0,
	"visibilityVariance": 1.41424E7
	},
"speedStats": {
	"speedMax": 1.77,
	"speedMin": 0.82,
	"speedAverage": 1.456,
	"speedVariance": 0.123450400000000002
	}
}
Metadata related to future forecast statistics data:
{
    "attendibilità": {
        "speed": false,
        "visibility": true
    },
    "numeroGiorni": 5,
    "soglia_errore": "50.0%",
    "cityId": 3
}
In detail:
- “date” indicates the date of the day to which the reported data refer;
- “visibility” indicates the numerical value expressing the visibility relative to that city on that day;
- “cityname” indicates the city;
- “timeUnix” indicates The date expressed in seconds as of January 1, 1970;
- “speed” indicates the numerical value expressing the wind speed relative to that city on that day;
Considering instead the metadata related to historical data statistics:
- “visibilityMin”, “visibilityMax”, “visibilityAverage” e “visibilityVariance” denote the minimum, maximum, mean, and variance, respectively, of the visibilities of the days considered.
- “speedMin”, “speedMax”, “speedAverage” e “speedVariance” indicate the minimum, maximum, mean, and variance of the wind speeds of the considered days, respectively.
Considering instead the metadata related to future forecast statistics:
- “attendibilità” Contains the answer on the reliability of future forecasts compared to current data.
- “speed”, “visibility”Are the attributes of which the reliability of future forecasts is evaluated.
- “numeroGiorni” indicates the amount of days over which statistics are calculated.
- “soglia_errore” highlights what the error threshold of the result is.
- “cityId” indicates the reference number of the chosen city (1 for Trieste, 2 for Ortona, and 3 for Venice).
Statistics
The statistics that the REST API returns are distinguished into:
statistics related to historical data (through a JSON file the values described above, i.e., mean, variance, minimum and maximum values, are illustrated). The city and period to be evaluated are chosen by the user.
- statistics related to future data (through a JSON file, the user is shown whether the predictions, based on the collected data, were reliable or not). The user will also choose the error threshold through which the reliability will be evaluated.
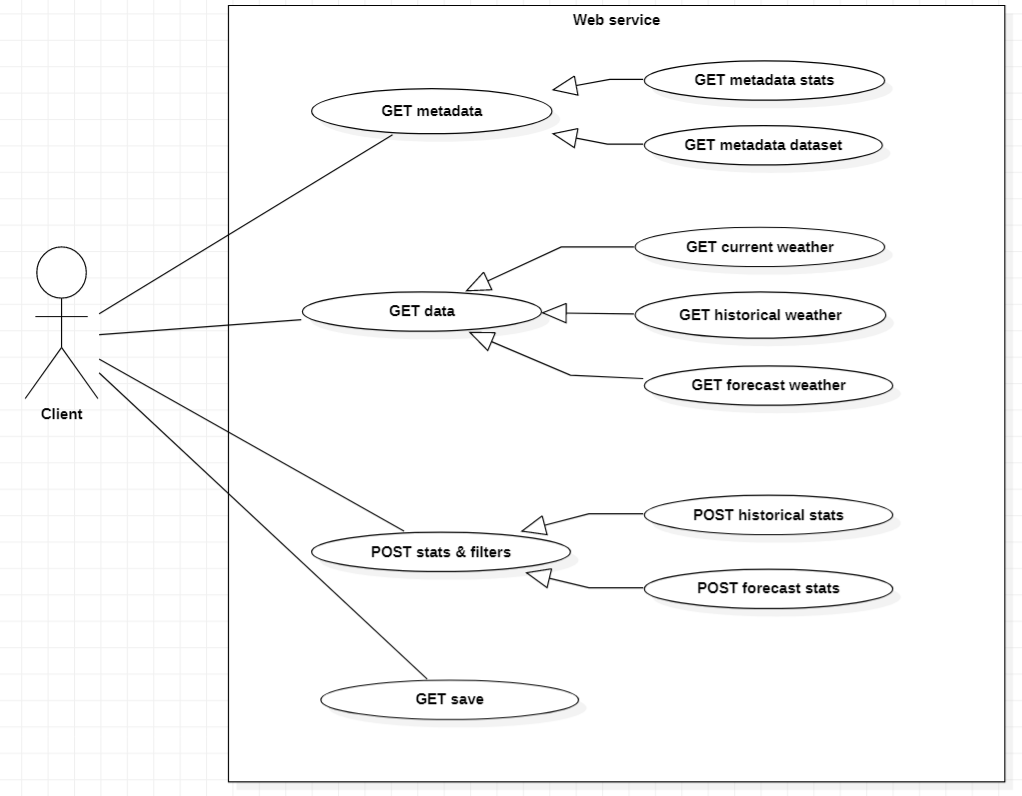
Application routes
| Call type | Route |
|---|---|
| 1) GET | /metadata/weather |
| 2) GET | /metadata/stats </tr> |
| 3) GET | /save |
| 4) POST | /weather/current |
| 5) POST | /weather/historical |
| 6) POST | /weather/forecast |
| 7) POST | /stats/historical |
| 8) POST | /stats/forecast |
- Returns to the user the metadata related to the dataset
- Returns metadata related to statistics, both historical and future, to the user
- It was used to save the data in the dataset
Note: what is returned by this call is overwritten in the dataset. - Returns current data
- Returns historical data
- Returns future data
- Returns statistics made from historical data
- Returns statistics related to forecasts
Filters
The user can filter the data returned from the calls by choosing the city(ies) to return and the period to consider.
For calls 4, 5, and 6, the body (in JSON format) must be of the following type:
{
    "primaCitta": <n1>,
    "ultimaCitta": <n2>,
    "giornoIniziale": <n3>,
    "giornoFinale": <n4>
}
The numbers n1 e n2must be between 1 and 3 (1 for Trieste, 2 for Ortona, and 3 for Venice), so the user can choose which cities to show.
The numbers n3 e n4 instead must be between 1 and 5 ( days ranging from 01/01 to 05/01 for historical data, 06/01 to 10/01 for current data, and 06/01 to 10/01 for forecasts), so by doing so the user can choose the period to be considered.
Note: n2 must necessarily be greater than or equal to n1 (the latter case if only one city is to be considered), just as n4 must be greater than or equal to n3.
For call 7 the same body is used, but in this case n1 e n2 must be equal, as statistics can only be made for each individual city.
Call 8 has the following body (again in JSON):
{
    "primaCitta": <n1>,
    "ultimaCitta": <n2>,
    "giornoIniziale": <n3>,
    "giornoFinale": <n4>,
    "soglia_errore": <n5>
}
The same selection criteria apply for n1, n2, n3 e n4.
n5 must be a number between 0 and 100, and it stands for the percentage of error threshold.
UML
Use Case Diagram
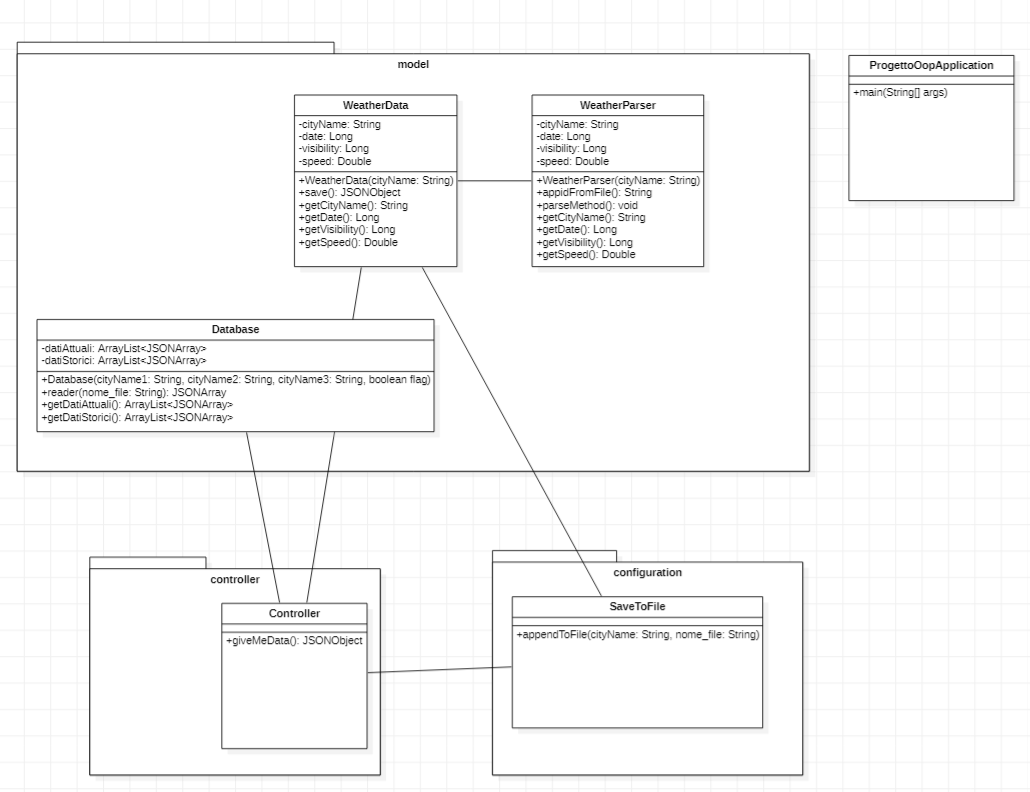
Class Diagram
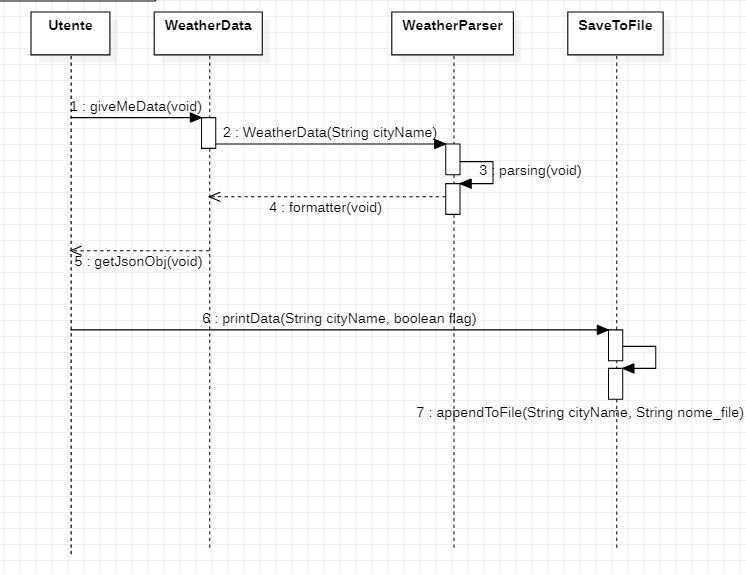
Sequence Diagram
External libraries
For the application to work, import the following libraries into the IDE: - json-simple-1.1 - junit5.
Note: the library json-simple-1.1 is present in the files of the repository.
Contributors:
- Colleluori Federico 50%
- Camplese Francesco 50%